TD Greystone Target Date Plus Funds Turn 10

In 1988, TD Asset Management Inc. (TDAM) began investing in multi-asset solutions on behalf of institutional clients. December 2014 marked the launch of the TD Greystone Target Date Plus Funds (TDFs) product line.[1]
The funds aim to redefine the Capital Accumulation Plan (CAP) member experience by providing a material exposure to private alternatives (typically only available for Defined Benefit pension plans) and the type of asset management which is usually available to institutional investors.
Since inception, risk-adjusted returns for the TDF vintages have been relatively strong: all the funds with a 10-year track record rank in the first quartile compared to peers on performance and risk measures such as Standard Deviation and Sharpe Ratio. (For more information about the performance results of the funds, please see Figures 3.1 and 3.2.)
Goals
From the onset, we set out to provide a differentiated solution for plan members that could better help them meet their retirement objectives (see Figure 1). We added private alternatives to our TDFs, we evolved our glide path to align it with plan member demographics and the investment environment, and we have provided positive outcomes for plan members while delivering a smooth return path year after year.
Figure 1: Design goals for the TD Greystone Target Date Plus Funds
Goal |
Status |
Evidence |
Include private alternatives into a daily valued pooled fund |
✔ |
20-25% allocation to private alternatives |
Evolve with plan members and market environments |
✔ |
|
Better capital longevity for members who decumulate within the plan |
✔ |
Retirement Fund demonstrates better capital preservation, higher returns and higher risk-adjusted returns than peer group |
Better account value for members at retirement |
✔ |
All vintages demonstrate top quartile returns since inception |
Deliver a smoother return path for all members |
✔ |
Lowest standard deviation (risk) among peer group |
Design features
- Inclusion of private alternatives:
Our TDFs have a 20-25% allocation to private alternatives. Incorporating private alternatives into TDFs has potential benefits, such as lower volatility and correlation with other asset classes, as well as hedging against inflation. Combined, these benefits have historically improved the Sharpe Ratio of the TD Greystone Target Date Plus Funds portfolio by approximately 30%, compared to a portfolio with public market stocks and bonds. The significance of a higher Sharpe Ratio is a smoother return path and higher member account balances.
- Evolving glide path:
An important consideration in a TDF is the glide path shape, or how the asset mix adjusts over time. Our approach reviews and adjusts the glide path annually based on evolutions in asset class or demographic assumptions in conjunction with our proprietary analytics. Market environments can change, so tactically tilting the portfolio relative to the strategic asset mix has the potential to add value and reduce risk.
- Discretionary rebalancing:
Another important consideration in managing TDFs is the rebalancing approach. At launch, we initially used a hybrid time-based and trigger range approach. From our research and the broader asset allocation experience, we found that discretionary rebalancing can help better maintain the asset mix, and it has the potential to boost returns and smooth out volatility. As a result, in 2021, we evolved to a discretionary rebalancing approach, which has added value since its implementation
These actively managed features in our TDFs may add value over the longer term, and that is demonstrated by our historical track record since inception, which informs our expected sources of value add (see Figure 2).
Figure 2: Expected sources of value add for TD Greystone Target Date Plus Funds
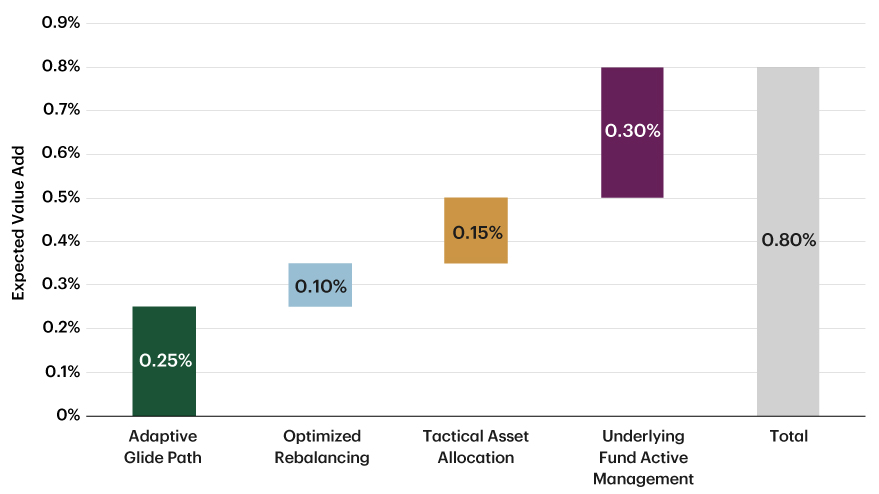
*Average result using 2.5% Equity Risk Premium and TDAM's Long-term Asset Class Assumptions.
Note: There is no assurance that expected value add will be achieved. Estimates are based on historical results.
Source: TDAM. As of December 31, 2024.
(For more information about the design features of our TDFs, please check out our earlier articles Bridging the Gap and Leading the Way.)
Expanding our tool kit
TDAM has a broad set of investment solutions that the Asset Allocation team, which manages the TDFs, can draw on. That solution platform spans equities, fixed income, private alternatives and commodities. We continually expand our tool kit with the goal of improving diversification and portfolio results for our clients. Over the years, as part of our annual glide path update, we have added equity styles, global unconstrained bonds, commodities, global real estate, emerging markets and global small cap, broadening our tool kit for TDFs. More details about year-over-year changes can be found in our Annual Glide Path Update papers, which are available on our website.
Fund performance
Our results demonstrate the potential advantages of including a significant weight to private alternatives in our TDFs. The anchor of income generation, combined with lower volatility, has resulted in lower market drawdowns than the peer group, providing resiliency in times of public market selloffs. The annual review of the glide path, tactical asset allocation, optimized rebalancing and active management of the underlying strategies have also contributed to the relatively strong results and our ability to provide consistent long-term risk-adjusted returns (see Figure 3.1).
Figure 3.1: Strong 10-year risk-adjusted returns relative to peer group
Exhibit A: 10-year returns
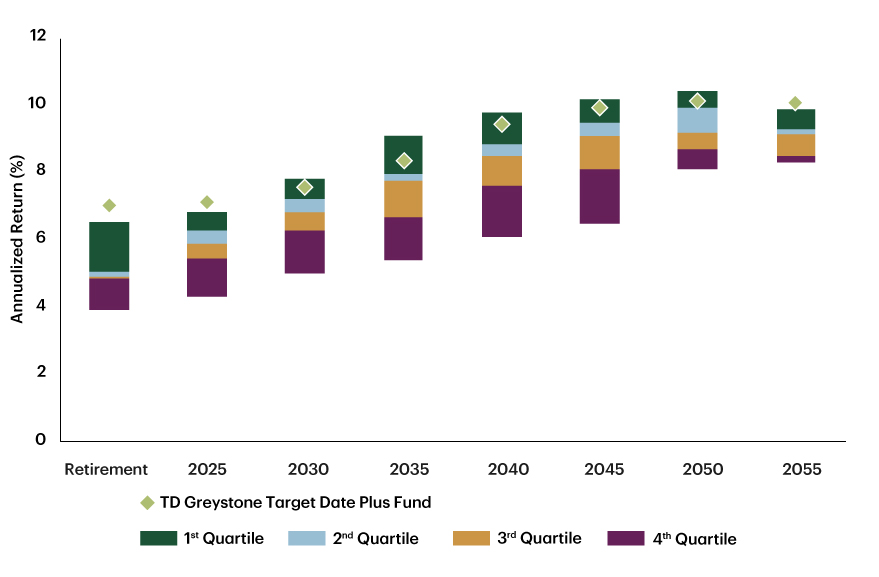
Exhibit B: 10-year standard deviation
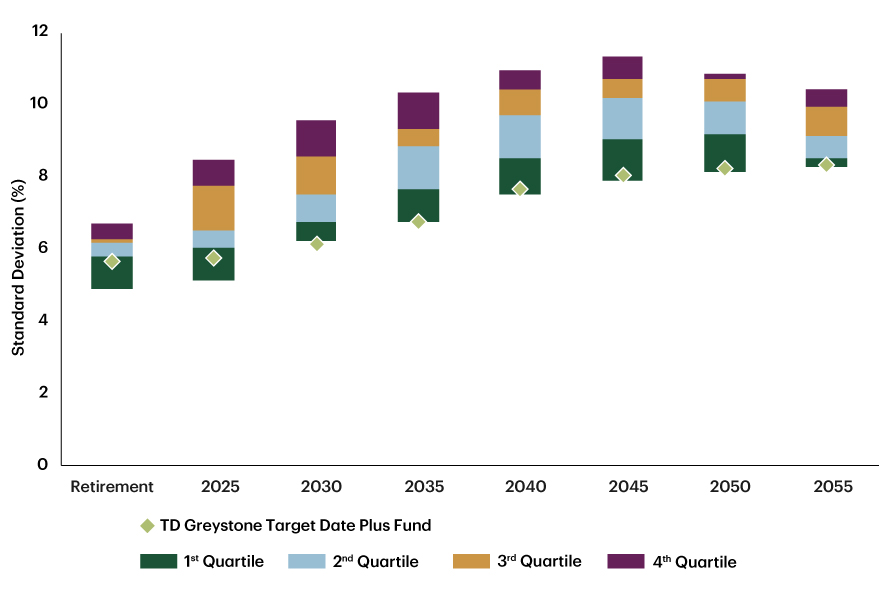
Exhibit C: 10-year Sharpe Ratio
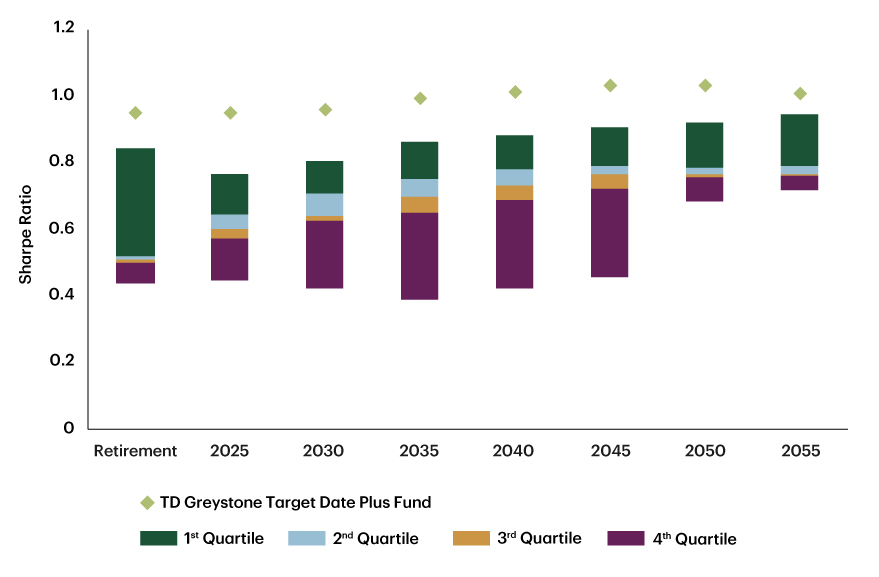
Source for Exhibits A, B and C: eVestment Alliance, LLC. As of December 30, 2024. Data pulled January 22, 2025.
Note about Exhibits A, B and C:
Each TD Greystone Target Date Plus Fund is compared against peers within the respective vintage’s eVestment peer group. The peer group is eVestment Alliance, LLC - Fund Category: TDF Income Fund - Canadian Universe. Current number of funds in the category: 3-8.
All funds are with a Canadian base currency or they include Canada in their list of "Products Available for Sale" field, excluding duplicate copies of funds within the peer group. Overall, this universe aims to provide a complete view of the Canadian TDF landscape.
Quartile rankings are intended to measure how well a fund has performed compared to other funds in its peer group. Quartile rankings are compiled by ranking all the funds in a category by return over a given period. The top performing 25% of funds in the category are assigned a quartile ranking of 1, the next 25% a 2, the next 25% a 3, and the bottom 25% of funds a 4. Quartile rankings can change over time.
Figure 3.2: Standard performance
| 3 mnths | YTD | 1 yr | 2 yrs | 3 yrs | 4 yrs | 5 yrs | 10 yrs | |
|---|---|---|---|---|---|---|---|---|
Retirement Plus fund |
1.72% |
11.32% |
11.32% |
9.46% |
4.94% |
6.49% |
6.79% |
6.92% |
| Benchmark* | 2.32% | 13.01% | 13.01% | 11.22% | 4.45% | 5.67% | 6.46% | 6.51% |
| Difference | -0.61% | -1.69% | -1.69% | -1.75% | 0.48% | 0.83% | 0.33% | 0.41% |
2025 Target Date Plus Fund |
1.73% | 11.38% | 11.38% | 9.47% | 5.05% | 6.49% | 6.77% | 7.01% |
Benchmark* |
2.32% | 13.01% | 13.01% | 11.27% | 4.48% | 5.68% | 6.47% | 6.55% |
Difference |
-0.6% | -1.63% | 1.63% | -1.8% | 0.58% | 0.81% | 0.29% | 0.46% |
2030 Target Date Plus Fund |
1.82% | 12.55% | 12.55% | 10.35% | 5.53% | 6.99% | 7.16% | 7.44% |
Benchmark* |
2.65% | 14.63% | 14.63% | 12.53% | 5.27% | 6.46% | 7.11% | 7.05% |
| Difference | -0.83% | -2.08% | -2.08% | 2.18% | 0.25% | 0.53% | 0.05% | 0.39% |
| 2035 Target Date Plus Fund | 2.12% | 14% | 14% | 11.24% | 6.4% | 7.97% | 7.94% | 8.26% |
| Benchmark* | 3.18% | 16.68% | 16.68% | 14.06% | 6.33% | 7.63% | 8.1% | 7.91% |
| Difference | -1.06% | -2.68% | -2.68% | -2.82% | 0.06% | 0.34% | -0.16% | 0.35% |
| 2040 Target Date Plus Fund | 2.33% | 14.94% | 14.94% | 12.2% | 7.12% | 9.16% | 8.9% | 9.33% |
| Benchmark* | 3.49% | 17.92% | 17.92% | 15.17% | 7.06% | 8.92% | 9.33% | 9% |
| Difference | -1.17% | -2.97% | -2.97% | -2.97% | 0.06% | 0.24% | -0.43% | 0.33% |
| 2045 Target Date Plus Fund | 2.53% | 15.95% | 15.95% | 12.86% | 7.6% | 9.82% | 9.47% | 9.83% |
| Benchmark* | 3.82% | 19.27% | 19.27% | 16.26% | 7.76% | 9.79% | 10.07% | 9.59% |
| Difference | -1.29% | -3.32% | -3.32% | -3.4% | -0.15% | 0.03% | -0.59% | 0.23% |
| 2050 Target Date Plus Fund | 2.63% | 16.49% | 16.49% | 13.14% | 7.98% | 10.09% | 9.66% | 10.03% |
| Benchmark* | 4.05% | 20.19% | 20.19% | 16.85% | 8.16% | 10.16% | 10.34% | 9.85% |
| Difference | -1.42% | -3.69% | -3.69% | -3.7% | -0.18% | -0.06% | -0.68% | 0.18% |
| 2055 Target Date Plus Fund | 2.65% | 16.56% | 16.56% | 13.37% | 7.77% | 9.79% | 9.48% | 9.95% |
| Benchmark* | 4.15% | 20.58% | 20.58% | 17.14% | 8.34% | 10.3% | 10.48% | 9.97% |
| Difference | -1.5% | -4.02% | -4.02% | -3.77% | -0.58% | -0.51% | -1% | -0.02% |
| 2060 Target Date Plus Fund | 2.75% | 16.96% | 16.96% | 13.58% | 8.06% | 11.1% | 9.92% | NA |
| Benchmark* | 4.31% | 21.23% | 21.23% | 17.64% | 8.52% | 10.7% | 10.84% | NA |
| Difference | -1.56% | -4.27% | -4.27% | -4.06% | -0.45% | 0.39% | -0.92% | NA |
| 2065 Target Date Plus Fund | 2.82% | 17.36% | 17.36% | NA | NA | NA | NA | NA |
| Benchmark* | 4.41% | 21.54% | 21.54% | NA | NA | NA | NA | NA |
| Difference | -1.59% | -4.18% | -4.18% | NA | NA | NA | NA | NA |
Source: TDAM. As of December 31, 2024.
*Each Target Date Plus Fund benchmark is set at the beginning of each quarter based on the target asset mix for the following quarter. The Target Date Funds benchmark composition is available upon request.
Note: Net of expenses. Numbers may not add due to rounding. Includes cash.
Looking forward
We have a deep commitment to our clients and continue to explore the topic of decumulation. Over the years, we have reviewed member objectives and the trade-offs that exist when balancing retirement priorities. We have highlighted sequence of return risk as a threat to member account balances when withdrawing savings. This is the risk to an investment portfolio arising from the inopportune timing of negative returns. If a portfolio suffers losses early on and the retiree is required to make a disbursement, their capital base may be permanently impaired.
Solutions with a larger allocation to private alternatives produce a higher Sharpe Ratio, which enhances decumulation outcomes by providing more income through retirement and better preservation of account balances (see Figure 4). We believe a healthy decumulation ecosystem that has a blend of tools -including fixed income solutions, Variable Payment Life Annuities and strong funds for withdrawal strategies - can help each plan member achieve their unique goals.
Figure 4: Private alternatives might help preserve capital
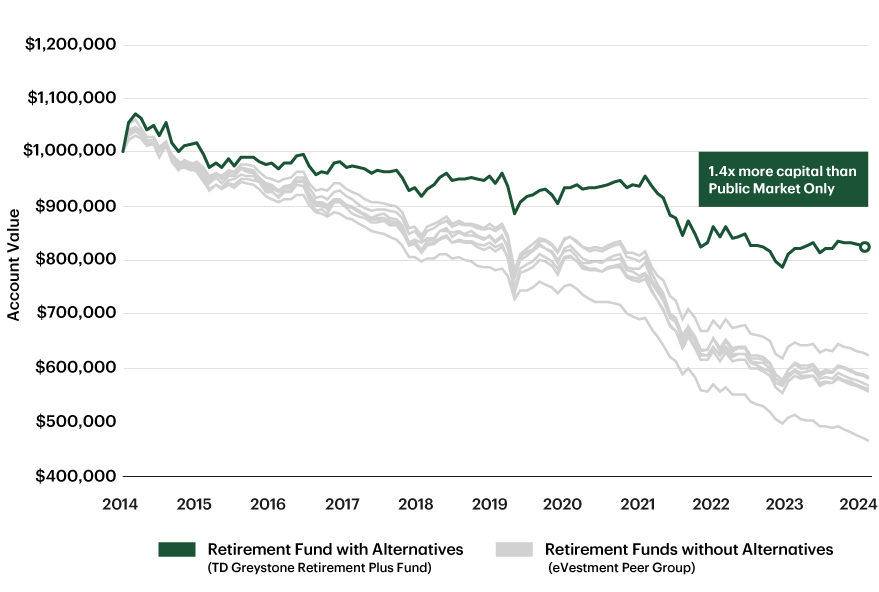
Note: The peer group is eVestment Alliance, LLC - Fund Category: TDF Income Fund – Canadian Universe. As from January 1, 2015 – July 31, 2024. Current number of funds in the category: 8. Annual withdrawal is 8% of initial investment.
Source: TDAM., eVestment Alliance, LLC. As of December 31, 2024.
Conclusion
We believe we have accomplished the goals we set out to achieve when designing and launching our TDFs in 2014 and this has resulted in strong risk-adjusted returns for plan members over the past 10 years. We will continue to evolve our TDFs over the next decade and beyond to CAP members' needs as the market environment and retirement landscape continue to change.
_______________________________________________________________
[1] The product line consists of eight funds which launched on December 31, 2014: 2025 Target Date Plus Fund, 2030 Target Date Plus Fund, 2035 Target Date Plus Fund, 2040 Target Date Plus Fund, 2045 Target Date Plus Fund, 2050 Target Date Plus Fund, 2055 Target Date Plus Fund, and Target Date Retirement Plus Fund. Two more funds were added to the product line later: December 31, 2019 saw the launch of the 2060 Target Date Plus Fund and the 2065 Target Date Plus Fund was launched on September 7, 2023.
For Canadian institutional investment professionals only. Not for further distribution.
The information contained herein is for information purposes only. The information has been drawn from sources believed to be reliable. Graphs and charts are used for illustrative purposes only and do not reflect future values or future performance of any investment. The information does not provide financial, legal, tax or investment advice. Particular investment, tax or trading strategies should be evaluated relative to each individual's objectives and risk tolerance.
This material is not an offer to any person in any jurisdiction where unlawful or unauthorized. These materials have not been reviewed by and are not registered with any securities or other regulatory authority in jurisdictions where we operate.
Any general discussion or opinions contained within these materials regarding securities or market conditions represent our view or the view of the source cited. Unless otherwise indicated, such view is as of the date noted and is subject to change. Information about the portfolio holdings, asset allocation or diversification is historical and is subject to change.
Past Performance: Any performance information referenced represents past performance and is not indicative of future returns. There is no guarantee that the investment objectives will be achieved.
No investment strategy or risk management technique can guarantee returns or eliminate risk in any market environment. Any characteristics, guidelines, constraints or other information provided for this material is representative of the investment strategy and is provided for illustrative purposes only. They may change at any time and may differ for a specific account. Each client account is individually managed; actual holdings will vary for each client and there is no guarantee that a particular client's account will have the same characteristics as described herein. Any information about the holdings, asset allocation, or sector diversification is historical and is not an indication of future performance or any future portfolio composition, which will vary. Portfolio holdings are representative of the strategy, are subject to change at any time and are not a recommendation to buy or sell a security. The securities identified and described do not represent all of the securities purchased, sold or recommended for the portfolio. It should not be assumed that an investment in these securities or sectors was or will be profitable.
All products contain risk. Important information about the pooled fund is contained in their offering circular, which we encourage you to read before investing. Please obtain a copy. The indicated rates of return are the historical annual compounded total returns of the funds including changes in unit value and reinvestment of all distributions. Yields, investment returns and unit values will fluctuate for all funds. All performance data represent past returns and are not necessarily indicative of future performance. Pooled Fund units are not deposits as defined by the Canada Deposit Insurance Corporation or any other government deposit insurer and are not guaranteed by The Toronto-Dominion Bank. Investment strategies and current holdings are subject to change. TD Pooled Funds are managed by TD Asset Management Inc.
Sharpe Measure is a ratio of returns generated by the fund, over and above the risk-free rate of return and the total risk associated with it and can change monthly. A high and positive ratio shows superior performance and a low and negative ratio is an indication of unfavourable performance. Standard deviation is a statistical measure of the range of a fund’s performance. When a fund has a high standard deviation, its range of performance has been very wide, indicating that there is a greater potential for volatility than those with low standard deviations.
Bloomberg and Bloomberg.com are trademarks and service marks of Bloomberg Finance L.P., a Delaware limited partnership, or its subsidiaries. All rights reserved.
This document may contain forward-looking statements (“FLS”). FLS reflect current expectations and projections about future events and/or outcomes based on data currently available. Such expectations and projections may be incorrect in the future as events which were not anticipated or considered in their formulation may occur and lead to results that differ materially from those expressed or implied. FLS are not guarantees of future performance and reliance on FLS should be avoided.
TD Global Investment Solutions represents TD Asset Management Inc. ("TDAM") and Epoch Investment Partners, Inc. ("TD Epoch"). TDAM and TD Epoch are affiliates and wholly-owned subsidiaries of The Toronto-Dominion Bank.
Related content
More by this Author